Mapping annual irrigation from Landsat imagery and environmental variables across the conterminous United States
Y. Xie et al. "Mapping annual irrigation from Landsat imagery and environmental variables across the conterminous United States" Remote Sensing of Environment 260 (2021) [DOI: 10.1016/j.rse.2021.112445]
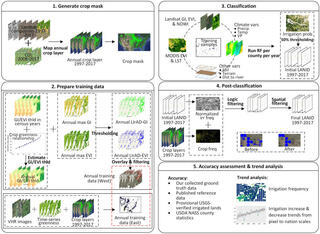
Identifying the location of irrigated croplands and how they change over time is critical for assessing and managing limited water resources to navigate such challenges as local to global water scarcity, increasing demands for food and energy production, and environmental sustainability. Although efforts have been made to map irrigated area for the U.S., multi-year nationwide maps at field-relevant resolutions are still unavailable; existing products suffer from coarse resolution, uncertain accuracy, and/or limited spatial coverage, especially in the eastern U.S. In this study, we present an approach to map the extent of irrigated croplands across the conterminous U.S. (CONUS) for each year in the period of 1997–2017. To scale nationwide, we developed novel methods to generate training datasets covering both the western and eastern U.S. For the more arid western U.S., we built upon the methods of Xie et al. (2019) and further developed a greenness-based normalization technique to estimate optimal thresholds of crop greenness in any year based on those in USDA NASS census years (i.e., 1997, 2002, 2007, 2012, and 2017). For the relatively humid eastern states, we collected data on the current status of center pivot irrigated and non-irrigated fields and extended these sample points through time using various indices and observational thresholds. We used the generated samples along with remote sensing features and environmental variables to train county-stratified random forest classifiers annually for pixel-level classification of irrigated extent each year and subsequently implemented a logic-based post-classification filtering. The produced Landsat-based Irrigation Dataset (LANID-US) accurately reconstructed NASS irrigation patterns at both the county and state level while also supplying new annual area estimates for intra-epoch years. Nationwide pixel-level locational assessment further demonstrated an overall accuracy above 90% across years. In the 21-year study period, we found several hotspots of irrigation change including significant gains in the U.S. Midwest, the Mississippi River Alluvial Plain, and the East Coast as well as irrigation declines in the central and southern High Plains Aquifer and the southern California Central Valley, Arizona, and Florida. The resulting 30 m resolution LANID-US products represent the finest resolution account of nationwide irrigation use and dynamics across the United States to date. The developed approach, training data, and products are further extendable to other years (either before 1997 or after 2017) for continuous monitoring of irrigated area over CONUS and are spatially applicable to other regions with similar climate and cropping landscapes.
The produced LANID irrigation maps are available through Google Earth Engine (Asset Id: “users/xyhuwmir4/LANID/LANID_v1_rse”).
